back to blog overview
Break Fluid Wear Noise Testing
April 29, 2025
Reading time: 2 min
Another topic of the task force and workshop measures launched in 2014 on the sealing tribological system in vehicle brake hydraulics is the noise / NVH behavior of brake fluids.
The small noise tester, noise and stick-slip tests friction-focused investigations in series production
Another topic of the task force and workshop measures launched in 2014 on the sealing tribological system in vehicle brake hydraulics is the noise / NVH behavior of brake fluids.
This primarily concerns the seals in the master brake cylinder and possibly the clutch cylinders if these are also operated with the brake fluid as the hydraulic medium. Depending on the installation in the vehicle, loud noises caused by stick-slip effects can get into the vehicle interior via the side wall.
Thanks to our numerous options for detecting the stick-slip effect, we have been able to develop a much simplified test device based on a simple SRV test (vibration-friction-wear device, Optimol Instruments), which covers the required load and frequency ranges without exceeding the dimensions of a shoebox. Of course, it is essential here that the test device itself generates a desired stick-slip signal when excited with its stiffness or compliance. In addition to soft variants with strain gauges for a broad stick-slip effect in the range up to 500 Hz, there is also a pre-series version of the device with piezoelectric force measurement in the range up to 10 kHz.
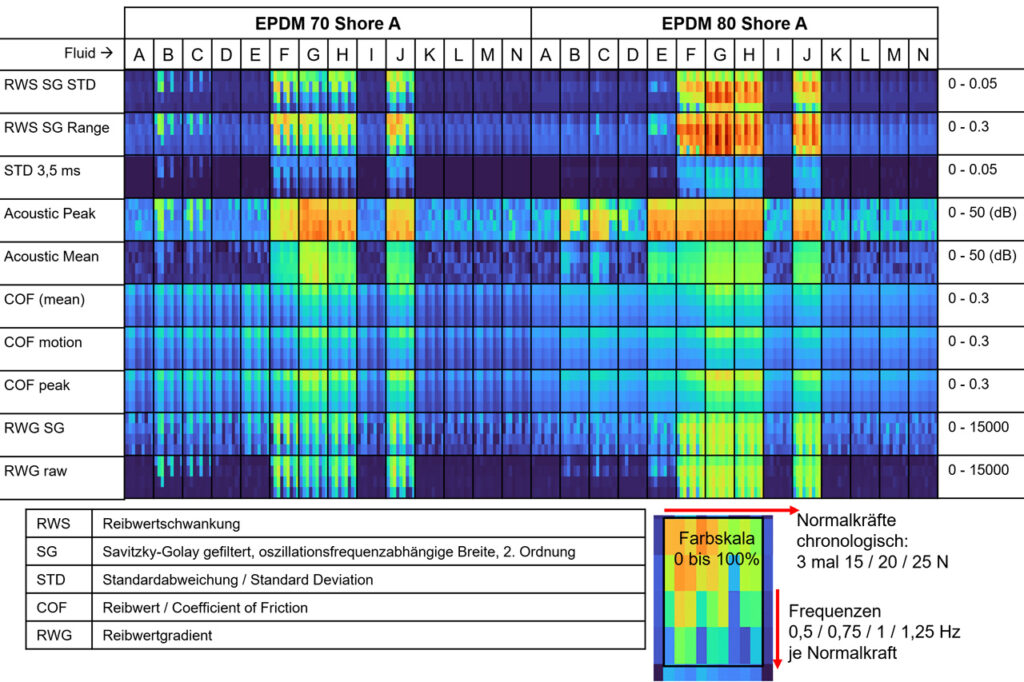
The overview of a series of measurements shown in the picture shows differences in the choice of sealing material and brake fluid. Here, two EPDM samples of different hardness and composition and fluid samples from A to N are shown.
Various characteristics based on the friction measurement and the acoustic microphone measurement are plotted line by line. The basic square with normalized colour scale again has the subdivision of normal force and frequency in the test. The friction and noise behavior of each liquid can thus be comprehensively assessed. Accordingly, dark blue for the lowest value to red for the highest observed value.